Do stocks trading near cash offer free upside?

by Alex Martinez-Forte
Alex Martinez-Forte is an Analyst, Strategic Finance at RA Capital Management.

April 8, 2022
When a biotech company is trading at around the value of the cash it has on the balance sheet, is it a comparatively safe investment with essentially free upside? Some investors might think so - and so we looked at the data.
As with many interesting questions, the answer is “it depends” (or else this would be a tweet); these companies don’t necessarily protect you from downside risk - but their overall risk/reward propositions may be greater, with a lot of caveats we’ll get into. The details might even surprise you.
For example, it depends on how a company gets to that point. Given the long timelines, high costs, and high risks inherent to drug development, any company can crash down to a low valuation because of a setback specific to them. But sometimes, macroeconomic or broader sector sentiment may turn sour, causing investors to sell shun biotech in general, driving stocks of many companies down, as we’ve seen over the last year and especially during the first quarter of 2022.
During such downturns, some companies are hit harder than others, and as with any distribution, there are extreme outliers. At the end of March 2022, there are 61 biotech companies that have at least $100M net cash as of YE21 trading at or below cash. Of those, 47 are trading at least 20% below their net cash.
On the surface, you would think you have a chance to pay $80 for a wallet with a $100 bill in it. Pretty good, right? Hold that thought.
Enterprise Value
To help standardize how we talk about the value of biotech companies, let’s define one key term: Enterprise Value (EV).
The exact equation of EV is Market Capitalization + Debt - Cash. Market Cap is the number of shares outstanding multiplied by the share price (with some debate over how to treat options and warrants). Most biotech companies have little debt since lenders like collateral and most biotechs have no hard assets to offer as collateral aside from intellectual property – which is often worthless if a drug trial fails, a risk lenders are not willing to take.
But when dealing with companies with very low valuations, even a small amount of debt can matter and you need to get the share count right. So if you think you see a company with a $100M market cap and $120M of cash (seemingly a -$20M EV), double check that they don’t really have 10% more shares outstanding right now than whatever financials the market cap is based on and don’t ignore the $20M debt facility, because those two tweaks are the difference between a perceived -$20M EV and a +$10M EV.
That’s how you calculate EV, but more important is its meaning. EV is the market’s implied present value of future cash flows to shareholders. That sounds very financial and makes it sound like a room full of monocled investors sit around with spreadsheets debating cash flow projections. But a more accurate way to convey this is that EV emerges from the frenzy of investors buying and selling stocks for many different reasons, only some related to the company’s plan for generating future profits.
Amidst a macro panic linked to inflation and war, some investors might decide they can’t be bothered with making sense of all the biology biotech companies keep talking about or whether they will be able to raise funding. So they may push the sell button without really giving a second thought to what each company’s cash flows might be someday.
That’s an opportunity for any investor willing to do their work and conclude “Hey, this company has a great drug candidate, and it’s likely to generate a lot of profit! This stock should be worth more, but it’s being sold for so little. I’ll buy some!” But during a macro panic, few investors may care to apply such analysis to biotech given all the other businesses, including profitable ones, that are trading down. So with few buyers and lots of sellers, the price of many companies may drop to levels that even the major sellers know are absurdly low. Some day-traders at the margin can cause the stock to gyrate on low volume, but if the big institutional investors aren’t finding prices at which they can agree to transact, then you don’t see much volume.
So if you are a CEO of a company whose stock has plummeted during a macro panic and is now languishing with low volume trading, don’t take it too personally. It can happen for many reasons.
Below Zero?
When a company’s EV drops below zero, the market is saying that the stock would be worth more if the board shut down the business. Indeed, activist investors can sometimes buy up the stocks of companies trading below cash and push the board to cut spending, sell the company for cash to another company, and, worst case, distribute out the cash for shareholders to reinvest elsewhere.
It’s kind of like seeing that there is a safe on sale with a burning pile of money in it that you can buy for less than the value of the money … and the first thing you do is put out the fire … stop the burn, sell the now-more-valuable safe to someone else to open, or crack open the safe and recover the money directly.
Investors might not be right in valuing a stock so low that the EV is zero or even negative. But arguably a management team with an objectively great plan is accountable for inspiring others to appreciate the merits of their plan. When management does a poor job of conveying the merits of their plan to investors, they may want to blame how myopic investors are, but it doesn’t change the fact that management is accountable.
Still, when the markets are in the midst of a macro panic, boards probably shouldn’t blame management exclusively for investors not “getting it.” A Cat 5 hurricane can overwhelm the skills of even the best sailors. Maybe all one can ask is that the CEO and management team keep the company funded at any price through a major market downturn, regardless of dilution, so that the most valuable R&D continues uninterrupted.
In any case, at any given time, there are companies that for their own reasons are trading at or below net cash and struggling to convince investors that they are worth more.
The question we are asking is: Do these stocks make for safe investments in a volatile market while offering essentially free upside?
Again, I’m not going to answer that until we define what we mean by “safe.”
Identifying safe companies
A low EV isn’t an indicator of whether it might be considered a “safe” investment in rough times. A company could get to the same EV in a number of different ways. For example, a company with a $100M market cap and $50M in cash with a $100M burn would have the same EV as a $500M market cap and $450M in cash with a $100M burn, but those two companies have vastly different risk profiles.
The first company has six months worth of cash remaining before they need to raise, which may cause significant dilution (raising one year’s worth of cash would dilute every shareholder’s stake by half); the other has 4.5 years of cash remaining, quite a lot of time to ride out a down market or achieve clinical success, and at their current valuation, raising an extra year of cash wouldn’t even be all that dilutive (18% dilution).
Similarly, a company with a $100M market cap, $100M in debt, and $150M in cash has different risk profiles depending on their cash burn. At a $200M burn, the company would be at risk of running out of cash and defaulting on its debt if they aren’t able to refinance or raise more cash; at a $50M burn, it might have sufficient time to get to its next clinical inflection point. So knowing the burn rate is important.
In fact, it’s probably helpful to talk about how cheap a stock is by saying “it’s trading a year of burn below net cash,” as is the case of a company with a $200M market cap, $300M net cash, and $100M/year burn rate.
But is that safe? Not necessarily. Just because a company has a lot of cash doesn’t mean you can access it as a shareholder. If the company spends that cash and doesn’t have anything to show for it, its stock can go to zero. So it’s not like buying a cash filled wallet and taking the cash out of it. If you buy the stock of a company trading below its cash value, the only way you can access that cash is either by waiting for management to distribute the cash willingly to shareholders (which happens very rarely) or by taking the time and spending the money to force the company to do this (i.e., turning activist). So it’s rational for a stock to trade below cash if investors don’t value what it’s working on and fear that the cash will be spent.
And yet, there’s always that chance that someone turns activist and recovers that cash whether the board likes it or not. Another company could come along with a hostile $250M offer to acquire a company with $300M of cash trading at $200M, and it would typically just take a majority of the shareholders to say yes to a quick 25% return for the deal to go through. That possibility might keep a company with $300M of net cash from trading down to a $150M market cap or $100M market cap even if the rest of the stock market is collapsing.
So surely companies with a lot of net cash trading at low EVs offer some safety to the downside, especially if they aren’t burning the cash too quickly. Let’s check it out.
Building our SAFE baskets
For this exercise, we identified companies that have at least a $30M burn over the preceding twelve months, had a positive net cash balance, at least 1 year of cash, and an EV/Cash ratio < 0.25x. That means that we would include a company with a $125M market cap, $100M cash ($25M EV), and at least a $30M burn. However, we would not include a company with a $50M market cap, $60M cash (-$10M EV) and $10M burn because we simply don’t consider that company to be engaged in a credible amount of spending to be considered for the analysis. Such a company might be a safe investment in that it won’t drop much, but no public biotech spending that little is likely to inspire investors to believe that it will create value. Odds are, it’s just in survival mode. Since we are looking for safe investments with “free” upside, we want to see enough burn to believe there is a credible shot at upside. Hence the >$30M burn criterion.
The low EV/Cash ratio helps us identify companies whose valuations are beaten down and are trading near cash. They can be trading as much as 25% above their cash levels to be included, so we’re not just dealing with zero and negative EV companies.
We analyzed two separate periods, 2018 and 2020. We would’ve liked to see the 2015 drawdown as well, but there was an insufficient number of companies that met our strict criteria from which to meaningfully derive conclusions.
We picked moments in time when the XBI ETF was dropping steeply, suggesting a general panic period that was taking biotech down indiscriminately. We picked October 10, 2018 as a start date when XBI had dropped -15% from its recent high and investors might have started to think “Surely it won’t go down too much more… I wonder if I can buy up a basket of cheap biotech and trust it to be pretty safe if the market keeps going down and then outperform the market when there’s a recovery?”
Of course, what we know from looking at the chart in Figure 1 is that the market does continue to go down, which is perfect for this analysis because the question is whether “safe” companies are indeed safe if the market keeps going down. And once we start buying stocks that met our selection criteria, we stuck with the strategy, buying more stocks that met our criteria whenever XBI dropped by another 5% (See Figure 2).

Figure 1: Shows the runup of XBI into the 4Q18 correction and the correction itself. Red dots mark moments when we’ll be buying stocks that meet our selection criteria. The buying started when XBI was 15% from its recent high and then 5% increments thereafter.

Figure 2: As the downturn in the biotech markets shown in Figure 1 progressed, more stocks met the selection criteria for the SAFE basket.
Figure 2 shows how many companies met our criteria for the Safe basket on each of the dates of the late 2018 market drawdown. As market valuations fell, more companies met our criteria.
Some might assume that low-EV stocks won’t collapse as far as the broader biotech market would in a down market. We tested this theory by graphing the performance of our basket vs. the XBI. If the hypothesis were correct, we would expect these stocks to outperform as the market fell, providing a backstop to large losses since they’re safer. Yet, that wasn’t the case. We found that its performance was worse than XBI’s as XBI dropped (Figure 3).

Figure 3: We modeled the performance of purchasing the stocks that met our selection criteria for the SAFE basket on each of the four buying dates shown in Figures 1 and 2. All resulted in steeper losses than XBI as the downturn continued. SAFE is therefore misnamed.
Performance of the individual groups of stock we bought on each selection date is shown in Figure 3. You can see that from each of the three timepoints, the basket that we thought was SAFE was not safe compared to XBI. These are stocks that had been dragged down by the market drop and, however cheap they may have seemed, as the market dropped further, these stocks really underperformed.
We also checked to see if the subset of companies that had a longer cash runway, at least two years’ worth, made for a SAFER basket. They didn’t (not shown). They performed as poorly as the original SAFE basket. So much for the notion of financing overhang.
In search of reward
OK, so these stocks are not safe. But maybe their greater risk and low valuation means they will offer more upside over time, especially if the market recovers. Let’s test that out.
First we need to iron out our buying strategy.
Let’s say we created a portfolio that buys an equal dollar amount of each stock ($1,000) when the market experienced a 15% drawdown and then continued buying each new stock that met our criteria every time the market experienced an additional 5% drawdown. The 15% drawdown limit was crossed on October 10, so we deployed $17,000 across the 17 stocks that met our criteria at that point. On October 23, when XBI’s drawdown crossed -20%, we deployed an additional $6,000 across the 6 new stocks that met our criteria and so on.
Since we only buy the new stocks that meet our criteria for each selection date, it’s possible that a stock that met our criteria on previous selection dates no longer meets our criteria on a later selection date, but we would still count that stock since we already bought it. We’ll talk about nuances of selling strategy in a bit, but for now assume we are holding whatever we bought. So how would the portfolio perform relative to XBI? (Figure 4.)

Figure 4: The SAFE basket gets dragged down with the rest of the market (XBI) and then recovers from the nadir about in sync with XBI. One might assume there is no outperformance to be had from this basket. But see Figure 5.
Judging from Figure 4, it would seem that our basket drops with XBI and then recovers in-line with XBI without any outperformance all the way through the end of January 2019. At this point, one might say that the experiment is over. But one might also say that XBI is still below its 2018 highs and that they want to bet on a further recovery from the macro panic. So let’s see what happens with the basket as time goes on. (Figure 5.)

Figure 5: The SAFE basket ends up outperforming XBI by as much as 30% about 3-4 months after the recovery starts, rewarding the patient investor, though the basket gives up a significant portion of its outperformance by the end of the year, leaving it with ~11% outperformance, suggesting that maybe the buy-and-hold strategy isn’t the best we can do.
Figure 5 shows the basket significantly outperforms XBI, by as much as 30% within 3-4 months after the start of the recovery. However, the buy-and-hold strategy results in the basket giving up most of its outperformance towards the end of the holding period. So maybe we’ll need to explore some kind of selling strategy to try to lock in gains before they dissipate as time goes on and companies deviate further and further from the initial selection criteria that made us want to buy them.
Still, to be fair, the basket does end the year with ~11% of outperformance, so one might think that the “buy low EV companies during a downturn and hold them for a year” is a good approach. But let’s pressure test this conclusion.
There are three features of this crude investment strategy that we should explore.
1. FRAGILITY: We should check how fragile it is by removing the best performer from the basket. If the strategy still performs well, we can say the positive performance is based on more than just one lucky stock. Figure 6a shows the performance relative to XBI with the best stock removed from the basket. Notice how much performance is sacrificed. This strategy appears somewhat fragile, and yet, it still generates a smidge of outperformance, so let’s generously say it passed the test, especially since the basket clearly outperforms XBI initially and we’ll explore whether we can lock in those gains somehow before the stocks regress. (Figure 6a.)

Figure 6a: Testing fragility - Shows performance of the SAFE basket vs XBI but with the best performing stock removed from the basket.
Indeed, anyone looking at these charts might say “Who cares about the performance at the one-year mark… I’m in it for the initial recovery surge!” OK, but you really can’t pick the top ahead of time. You need some selling strategy that makes sense. Buy and hold for one year is one. But let’s just say you did decide to hold for just the right time to catch the top.
How fragile is that strategy? Check out Figure 6b where we remove the best performer based on each stock’s performance through peak in mid-March. Performance was cut back ~5% for the Safe basket. Still, it outperformed XBI, so let’s say that this passes the fragility test, too. We’ll come back to how it might be possible to capture the upside of that initial recovery so as not to give it up when the market goes back down.

Figure 6b: Testing fragility if you terminated the strategy at the peak in March. Removing the best performer cuts outperformance by about ~5%, but the basket still outperformed the market.
2. SENSITIVITY TO STARTING CASH: There are exactly 46 stocks that end up meeting the selection criteria for the SAFE basket, and yet, how could we have known that when we started buying qualifying stocks in October? We couldn’t have. Had we started with $20k when we started buying the first 17 companies, we would have had only $3k left to buy more stocks that met our criteria and we would have run out of money with which to buy all the others that qualified later. Had we started with $60k, then by the time we finished buying the 46 qualifying stocks, we would have had $14k of cash weighing down our portfolio as we waited to see if the market dropped further. So our model of starting with $46k is artificial.
Figure 7 shows what would have happened if we started with less cash and ran out of money just before being able to buy the 4th set of companies (we call that the “-1 selection date” and it’s the gray line in the chart below). The answer is it would’ve exacerbated the downside during the correction and would’ve caused the SAFE basket to underperform XBI. If we had started with too much cash, twice more than it would turn out we needed (we call that “2X cash” and it’s the red line in the chart below), we would have outperformed XBI modestly by the end of the year though would have have significantly blunted the initial outperformance that makes this whole strategy seem promising (note that excess cash also blunts the downside early in the strategy when the market is still correcting … excess cash just blunts volatility of the strategy overall).
From looking at these two options, it’s hard to tell if it’s better to deploy your cash conservatively on the downslope and risk ending up with undeployed cash blunting your volatility or invest aggressively and risk missing out on buying nearer the bottom. It really seems to depend on how you end up selling your positions. If buying and holding for a year, then better go slow and risk ending up with excess cash. But that’s just a hypothesis based on one data set. We’ll pressure test that later.

Figure 7: Analyzing sensitivity to starting cash balance. Too much cash dilutes the returns, blunting them on the way down when the market is still correcting but dampening the upside. Too little cash exacerbates the downside and may result in underperformance.
3. LOGICAL SELLING STRATEGY: Is it realistic that one would start with selection criteria that focus on how cheap and well capitalized a company is at one given point in time and then just continue to hold those stocks for a full year regardless of what happens to their valuations? Every day you hold a stock, you are essentially saying “if I didn’t own it, I would buy it.” The one difference is taxes. So some people will try hard to hold for a year to get more favorable long-term capital gains treatment of their realized gains.
But if a stock in the basket goes up by a lot, then it really does fail to continue to qualify for this “SAFE/CHEAP strategy” and a reasonable selling discipline would be to lock in the gains. So, what if we applied an ACTIVE SELLING STRATEGY whereby we commit to selling any stock that goes up by X% over our purchase price. If X is 30%, then a $200M market cap company with a $50M EV would qualify for being added to our basket, but once it’s up to a $260M market cap, its EV is now $110M, 42% of the market cap, so not as cheap. Or maybe you set a goal of a 60% return. Let’s see how sensitive the returns are to that selling threshold X. And as we sell each position, let’s put the money into XBI so that it doesn’t sit around as deadweight. That will result in whatever outperformance we generate from each stock that meets our selling threshold being locked in as permanent outperformance vs XBI.
Figure 8a shows that having any limit from 10-60% does a good job of keeping whatever outperformance our portfolio generates in the first 3-4 months of the recovery from degrading as happens to the buy and hold strategy. A limit of 30% was better than both 60% and 10%. So that’s weird, and not intuitive; we don’t see how one could have guessed that ahead of time. And when we tried a limit of 150%, that did best of all, clearly better than buy-and-hold. And when we tried a limit of 150%, that did best of all, clearly better than buy-and-hold.
And we know that if you set the limit so high that nothing trips it, then the strategy is simply buy-and-hold (Figure 8b). So maybe one can do better than buy-and-hold, but it’s hard to know what limit to use.

Figure 8a: Performance of basket if actively selling at different limits.

Figure 8b: 150% limit approximates buy-and-hold
And yet, if we take taxes into account, buy-and-hold might come out ahead. Or we may be just reading too much into this one data set, not coming up with some universal truths.
If we do concede that buy-and-hold is our best strategy, we have something of a philosophical problem. It means that the SAFE/CHEAP “rules” that served as our rational basis for selecting companies end up being thrown out the window as individual stocks climb well above the levels where we consider them SAFE/CHEAP. It’s like saying that you will buy stocks of companies that work on oncology programs but then continue to hold those that switch to working on other diseases. That’s inconsistent and illogical. But hey, we’re pressuring testing an “easy-money” strategy that doesn’t require much thought, so let’s keep going with it.
Interestingly, though we don’t show it in these figures, stocks with at least two years of cash runway performed about the same as the basket we show here (which only required a company to have a minimum of one year of cash). So once again, no clear impact of so-called “financing overhang.”
As one final test, we combined all three pressure tests and decided to assume that we started buying a bit early and missed out on the 4th cohort of stocks, that we didn’t get lucky with the best performing stock in the portfolio, and that we used a 10% or 30% cutoff for our active strategy. Figure 9 shows that the basket would have closely resembled the performance of XBI for most of the year with the lower sell limit (10%) outperforming and the higher sell limit (30%) underperforming. The results of this test pokes a hole in the whole strategy; it shows that, under some realistic conditions, all of the outperformance of our strategy can vanish.

Figure 9: Combined test results vs. passive buy and hold return.
Pressuring testing our learnings with 2020 data
Let’s check out 2020.
As with 2018, we took a look at the 2020 drawdown and selected dates using the same methodology as previously described, as shown in Figure 10. Figure 11 breaks down the 45 stocks that met our criteria for this period.

Figure 10.

Figure 11.
The first thing we wanted to review was the performance of these stocks in the downturn to see if our previous conclusion still holds. It does. Performance of each selection cohort is shown in Figure 12 and, while stocks bought on some days did drop less than XBI, overall these data support the conclusion that this strategy is neither safe nor consistently safer than XBI when XBI is dropping. Notice that this market correction was much more acute than the 2018 correction, so the Figure 12 chart encompasses only nine trading days.
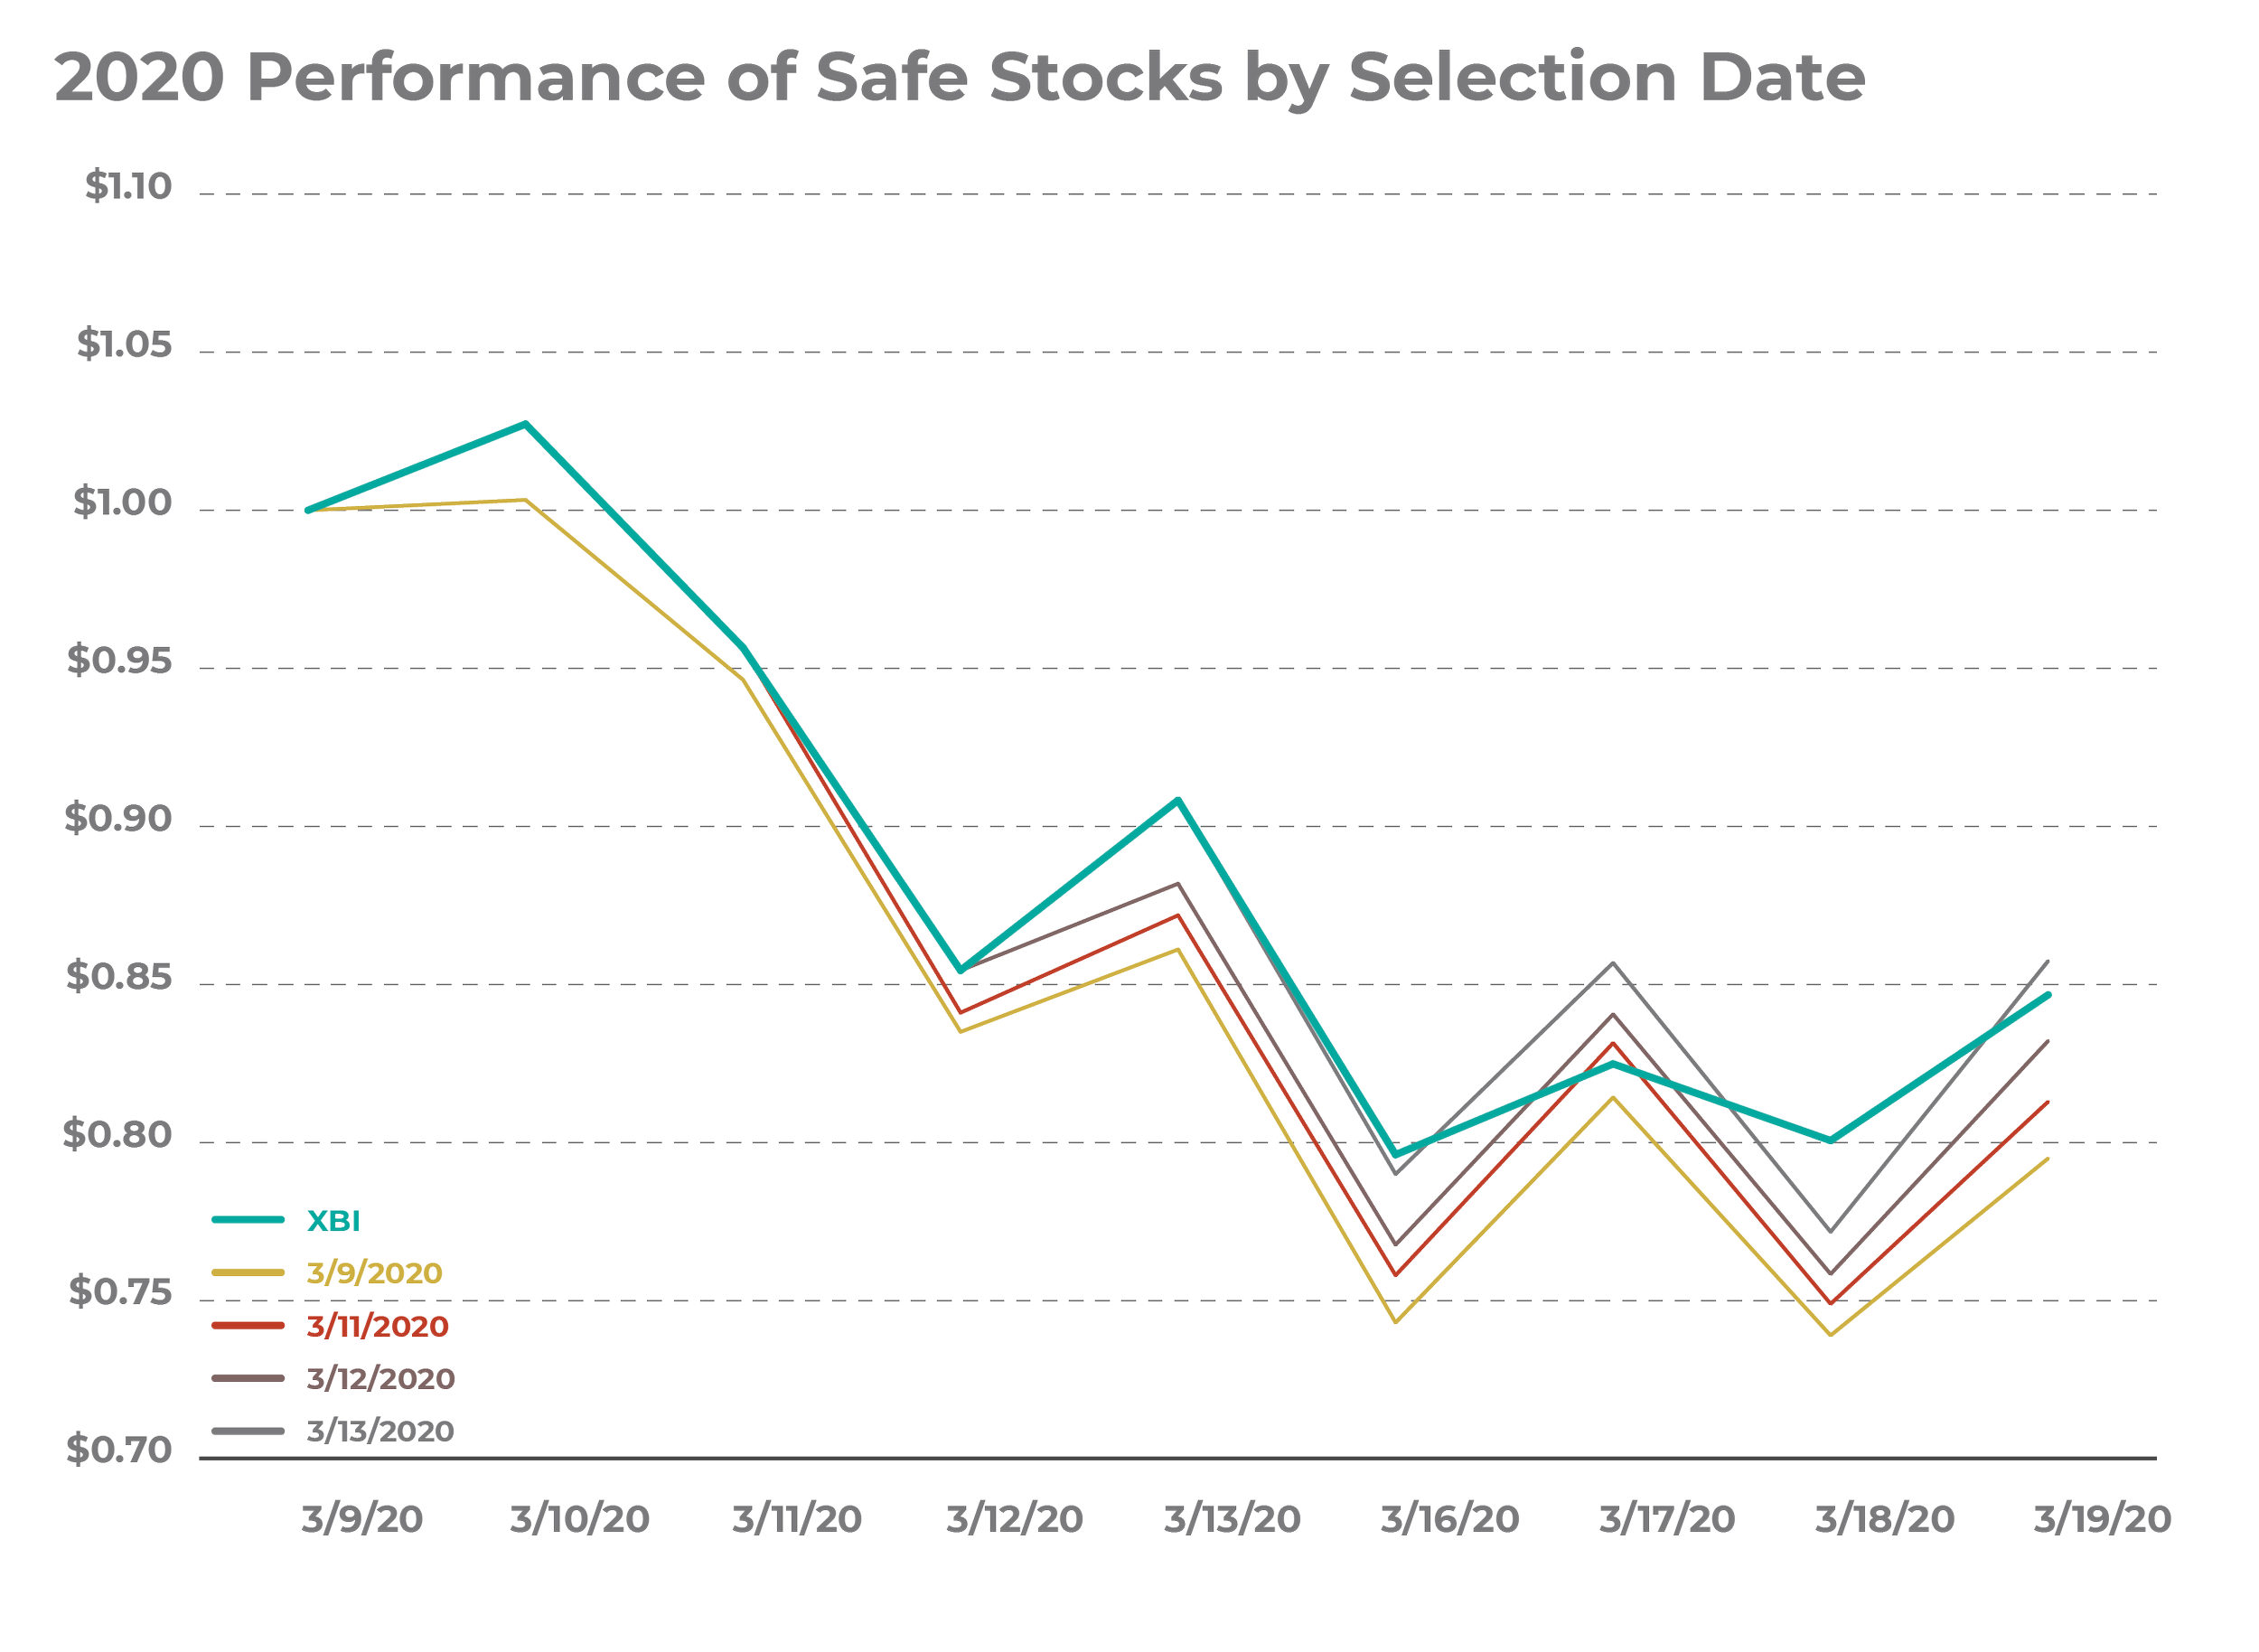
Figure 12.
When we assembled our basket, we found that these stocks bounced back faster than XBI and by the time XBI had reached around the same level as when we started, our basket was already outperforming by as much as 15%. Biotech stocks rallied into the end of 2020, and our basket further outperformed to end the holding period almost 100% ahead of XBI (Figure 13). Pretty cool. (Interestingly, the subset of our stocks that had a longer cash runway, at least two years, did not do as well, though still beat XBI by about 50% by the end of the 1-year holding period.)

Figure 13.
So the strategy starts to sound compelling, certainly more so than 2018 made us think. Now for some pressure testing.
1. FRAGILITY: Removing the best performer resulted in a significant change in performance for the safe basket, which had previously outperformed XBI by more than 100% (Figure 14). Our basket still outperformed XBI.

Figure 14: Testing fragility - Shows performance of the SAFE basket vs XBI but with the best performing stock (as judged by one-year holding period return) removed from the basket. In this case, the ultimate huge outperformance turns out to be driven largely by the single best stock, and yet there is still outperformance.
2. SENSITIVITY TO STARTING CASH: Starting with twice as much cash as we would turn out to need would reduce (dilute) returns, as one would expect, but in this case it proves disastrous in the longer run. That’s because after the 2020 COVID-induced crash, XBI went on to have such a strong year that you definitely would not have wanted to stay in cash. We couldn’t have known that, but it’s now clear how dangerous it can be to try to leg gingerly into this strategy during the downturn and risk ending up with excess cash. On the flip side, starting with too little cash and deploying it all early in the downturn, missing out on all the stocks on the last two purchase dates (we decided to model two missed dates since the 4th purchase day only adds two stocks to the large basket) turns out not to have mattered (Figure 15).

Figure 15: Analyzing sensitivity to starting cash balance. Better to have started with too little and deployed it all early in the buying process than to have started with too much and had leftover cash diluting down returns.
3. LOGICAL SELLING STRATEGY: Using the same methodology to sell positions once they’ve returned X% from their cost basis and invest proceeds into XBI, Figure 16 shows that the best approach would have been to just buy and hold, however irrational that seems at the outset. Still, a 60% threshold would have locked in plenty of outperformance.

Figure 16: Performance of basket if actively selling at different limits. Still good outperformance.
Figure 17 shows the performance of combining the effects of all three pressure tests and found that the 10% and 30% sell limits both outperform this time around. As before, we’re losing a significant amount of outperformance when we combine these tests, hinting that the strategy is a bit fragile with how we deploy capital, what sell limit we choose, and if our portfolio contains a miracle stock or not.

Figure 17: Triple pressure test. Still good outperformance.
Hypotheses and limitations
This exercise has dispelled some facile assumptions and helped us frame a few hypotheses. We would need more prospective testing before we call them “conclusions.”
Hypothesis #1: During a downturn, you can build a basket of biotech stocks that have low EVs and at least a year of cash (and longer runway not clearly better) which you can call CHEAP, but, if the market keeps dropping, your CHEAP basket is probably not going to protect you from losing at least as much money as investing in the XBI. This strategy is definitely not SAFE.
Hypothesis #2: If you have plenty of stocks to buy when you embark on the CHEAP strategy, then invest, let’s say, two-thirds of the money you allocate to this strategy in that initial basket and leave the remaining third for more stocks that meet your criteria. Odds are, you’ll end up deploying all your cash fully and there will be some stocks you don’t have cash to buy. That’s better than holding back too much cash and having excess cash drag down returns once the market recovers.
Hypothesis #3: When it comes to selling, you may as well take a buy-and-hold approach. This strategy is banking not on your basket being safer than the market but on it outperforming the market during the eventual recovery. And setting a sell-limit, while rational, risks you missing out on the best performers in your basket making your whole basket worthwhile. And while setting a limit still allows for some outperformance in most scenarios, the extra taxes incurred from selling in less than a year likely tilt the scales further in favor of buying-and-holding for a year.
To be clear, this strategy is hardly proven. That’s why we call these merely hypotheses. It’s based on just two downturns. As of early April 2022, we’re now in the midst of a 3rd downturn that is maybe starting to recover and will yield additional data. We’re tracking the set of companies that meet our CHEAP (formerly known as SAFE) criteria amidst this downturn. Time will tell if they outperform. We’ll publish an update in a year.
Why don’t we put on these trades ourselves? Because we’re an institutional investor, and we neglected to tell you one thing: this whole “strategy” falls apart as soon as you take liquidity into account. There’s very little trading volume for most of these stocks, especially as they drop to such low levels that their major shareholders entrench and wait for a recovery. So while a retail investor can buy $1,000 of each stock or even $10,000 of each stock, there are very few stocks in our basket with enough liquidity to move the needle for most institutional investors. Even if you allowed yourself up to 20 trading days when the stock qualified for our selection criteria*, 75% of the stocks in our 2018 or 2020 baskets have been too illiquid to put on even a $5M position.
So for professional investors managing any significant amount of money, these gyrations are functionally unrealizable. Realistically, it will mostly be those companies that have to raise during the depths of a downturn that might offer institutional investors a chance to build a meaningful position at those low prices. Sometimes a stock may have high liquidity for other reasons, such as a data release causing controversy and shareholder turnover, or maybe a shareholder capitulates (e.g., a fund shuts down) and one can buy large blocks, but these are rare events.
So this was a fun exercise, but it’s not applicable to us, and it’s not investment advice for you.
*20 trading days from selection date, excludes days when stock traded above 0.25x EV/Cash
Further Reading


Please click here for important RA Capital disclosures.